Climate is cooling according to Jones

Phil Jones is “the guy”, as in THE go-to guy when it comes to climate change.

In an interview where he complains about skeptics “spinning” statements he ultimately reveals this:

"I'm a scientist trying to measure temperature. If I registered that the climate has been cooling I'd say so. But it hasn't until recently - and then barely at all. The trend is a warming trend."

You can read the whole thing here:

http://news.bbc.co.uk/2/hi/science/nature/8511701.stm

Here’s the deal. IF human produced CO2 was a major factor in affecting global climate then there would be no “recent” cooling at all because CO2 production by humans has continued to steadily climb.

Moreover, it’s worth noting that the “recent” cooling that has been measured coincides with the precise time when people started really paying attention to the methods of data collection and started scrutinizing the data a lot more closely. 

83,302 views 81 replies
Reply #1 Top

http://tamino.wordpress.com/2010/02/16/growthgate/#more-2302

Suppose you have a child, a son — he’s 10. You want to know whether or not he’s growing normally, so every day you measure his height with a tape measure. You’ve done so since he was 5. You even plot the data on a graph, and notice two things about it. First: the measurements show a fair amount of jitter, sometimes they’re a wee bit higher, sometimes a wee bit lower, there’s noise in the data. Second: there’s also a trend. Your kid is a lot taller at 10 than he was at 5, in fact the trend over the observed time span is upward and reasonably steady. You even do a statistical analysis, estimate the growth rate, and determine that it’s definitely statistically significant — so it’s not a false trend due to noise in the data, it’s real. Your son is growing normally.

Then you’re interviewed by a reporter from the Daily Mail. He asks, “Can you prove — with statistical significance — that your child has been growing since last Tuesday?”

You reply that no, even though the trend over that time span is upward, it’s not statistically significant.

The next day you read the article in the Daily Mail which is titled, “Growthgate U-turn as parent admits: There has been no growth since last Tuesday.”

You protest. “I never said my child wasn’t growing! I just said that the data over such a short time span didn’t show it with statistical significance! That’s only because on such a short time scale, the noise obscures the trend.”

Alas, it’s too late, the damage is done, because 3500 blogs have repeated the article from the Daily Mail and child protective services has been asked to investigate your fitness as a parent.

Sound familiar?

Reply #2 Top

"Climate is cooling according to Jones

[…] The trend is a warming trend"


The title of your post disagrees with his analysis. His result:


He said he stood by the view that recent climate warming was most likely predominantly man-made.

I should point out that while I think the media has spun climate change into something it isn't, I also think there's significant truth to the underlying science. I must also commend you on your homebuilding project – that's real change and I applaud you for taking those steps.

I just didn't see much correlation between the title and that very slim comment, in effect, a small amount of spin within itself.


Reply #3 Top

Then you’re interviewed by a reporter from the Daily Mail. He asks, “Can you prove — with statistical significance — that your child has been growing since last Tuesday?”
End of quote

The figure was 15 years, which relative to the (supposedly more) reliable temperature records and the period used for comparison with the CO2 emissions is no where near as short as your (linked to) comparison would suggest.

Here's the link to the article in the daily mail:

http://www.dailymail.co.uk/news/article-1250872/Climategate-U-turn-Astonishment-scientist-centre-global-warming-email-row-admits-data-organised.html

In particular:

he said that for the past 15 years there has been no ‘statistically significant’ warming.

End of quote

anomalous results and 'noise' might explain cooling or non-significant warming for a year or two, but when you hit 15 years you're no longer talking about some tiny timeframe that pales into significance over the whole period. I can't remember when the comparison with CO2 is typically done from but if memory serves me it might be around 1960 onwards. So in that context it'd be like measuring your son from 5 to 10, and when he's 10 being asked if he's grown significantly in the last year and a half. After all the point of contention isn't so much about whether the earth is warming, but about whether we're a significant cause of that warming (via greenhouse gases), and so the initial timeframe for that comparison becomes much shorter.
Oh and if my son didn't show any significant signs of growth in 1 1/2 years at the age of 10 I'd start getting worried.

Meanwhile if 15 years really is insignificant, and like 'last tuesday' in the context of the child, then the same goes for the comparisons with greenhouse gases, which are only a few weeks ago!
Reply #4 Top

The Global Warming™ cultists are grabbing at any straw they can now.  Man-made global warming has been exposed as the fraud it always was.

Reply #5 Top

but when you hit 15 years you're no longer talking about some tiny timeframe that pales into significance over the whole period.
End of quote
Agreed. However that's not any random 15 year period that's a specifically selected period (i.e. cherry picked) which shows a strong upward trend that just happens to be barely below the level of statistical significance.

Actually I'm surprised the questioner picked 1995 as the start date, most peole specifically pick 1998 as the start date since 1998 was a particularly strong El Nino year. However cherry picking is still cherry picking. If you choose 10 year intervals and then go back and check all such intervals over the last 30 or 40 years virtually all of them will show a statistically significant warming. Or pick 11 years, or 12 or any other interval and do the same thing and you'll find that the large predominance of all of them show significant warming. Of course there will be the occassional interval at specific start and end dates that won't be significant. Mostly these will still exhibit the warming trend just simply they will be slightly less than significant.

As far as the warming having stopped, enjoy the break while you can because this Janurary, you know the one with all the snow in Washington that "disproved GW", was in fact the warmest Janurary *ever* and this information is from deniers like Watts and Spencer.

http://climateprogress.org/2010/02/05/hottest-january-in-uah-satellite-record-roy-spencer-global-warming/

You could change the title of this thread from "Climate is cooling according to Jones" to "Climate is warming according to Spencer" and be equally honest.

Reply #6 Top

Of course there will be the occassional interval at specific start and end dates that won't be significant. Mostly these will still exhibit the warming trend just simply they will be slightly less than significant
End of quote

The end (/start depending on which way you look at it) date isn't being cherry picked in this case though, it's just being taken from today/the most recent year which is what is typically done, so that means the only variable available for cherry picking is how long a period you look at, and the longer the period, the reduced likelihood of such cherry picking having a dramatic impact. That is, once you're looking at more than a 10 year period the effect of an additional year on the overall result will be reduced, thus limiting any attempts at cherry picking.

If say in the last 5-20 years (depending on the period being looked at) the only point at which there wasn't statistically significant warming was over a 15 year period then I could see the argument for cherry picking, but I doubt that is the case (I could be wrong, but I find it so hard finding climate figures from raw data that I can interpret next to impossible - I don't quite understand how I can find within a few seconds various graphs detailing the CO2 emissions per person by country and year, yet it's not easy to find a simple graph showing the average temperature per country per year. Then again it might just be that my searching methods aren't up to scratch)

Reply #7 Top

yet it's not easy to find a simple graph showing the average temperature per country per year.
End of quote
Well one reason is that climate is *global* if you want details of a specific country what you're looking for is *weather*.

The end (/start depending on which way you look at it) date isn't being cherry picked in this case though, it's just being taken from today/the most recent year which is what is typically done
End of quote
Even though the end date is today (actually 2009 as the most recent full year) that still doesn't make it random. If perhaps the most recent full year happened to be cooler than "average" for any particular reason then all trends ending in that year will appear to be lower than if that year was average. So both the start and end condition does come into play.

Here are two graphs demonstrating what we're talking about.

Clearly as you suggest the longer intervals have far fewer periods over the time period of interest that show any sort of decline, but that by no means suggests that all 15 year intervals are precisely equal or that a longer time interval regardless of start/end points is always a better measure, only that their variation is less.

Looking at the 15 year interval graph, the upward trend is pretty clear even though there are probably a number of lines whose slope happens to be slightly less than required to demonstrate a "statistically significant" upward trend. It's the totality of *all* the trendlines that conveys the complete information not just one line no matter how "fairly" that one particular line was selected and in the case of the questioner usually having an agenda that fairness is very often in doubt.

That's why most comparisons are made starting at 1998 and they make comments to the effect that global warming stopped in 1998. In this case they happened to back up the date a bit but isn't it convenient how that date is the next most recent maximum? Why didn't they back up the start to 1996 or 1994 or god forbid 1992 a local minimum? Because if they had they wouldn't get the result they want.

That's cherry picking.

Reply #8 Top

yet it's not easy to find a simple graph showing the average temperature per country per year.
End of quote

Yep, it probably would not be easy since....

“In a January 29 report, they find that starting in 1990, the National Oceanic and Atmospheric Administration (NOAA) began systematically eliminating climate measuring stations in cooler locations around the world. Yes, that's right. They began eliminating stations that tended to record cooler temperatures and drove up the average measured temperature. The eliminated stations had been in higher latitudes and altitudes, inland areas away from the sea, as well as more rural locations. The drop in the number of weather stations was dramatic, declining from more than 6,000 stations to fewer than 1,500.”


Reply #9 Top

The drop in the number of weather stations was dramatic, declining from more than 6,000 stations to fewer than 1,500.
End of quote


Oh come on! Surely they wouldn't drop data that wold cause a different average measurement, would they?


Sheeple are such dumb creatures. Don't confuse them with pesky facts, it only upsets them.

Reply #10 Top

“In a January 29 report, they find that starting in 1990, the National Oceanic and Atmospheric Administration (NOAA) began systematically eliminating climate measuring stations in cooler locations around the world. Yes, that's right. They began eliminating stations that tended to record cooler temperatures and drove up the average measured temperature. The eliminated stations had been in higher latitudes and altitudes, inland areas away from the sea, as well as more rural locations. The drop in the number of weather stations was dramatic, declining from more than 6,000 stations to fewer than 1,500.”
End of quote
Yeah, yeah. More garbage from Watts and D'Aleo, full of errors per usual.

Since you don't bother to provide any reference to this unnamed report I guess I'll have to do it for you.

The 111 page report itself is Surface Temperature Records: Policy Driven Deception? by Joseph D'Aleo and Anthony Watts, both infamous deniers with documented ties to ExxonMobil and whose expertise is pretty much limited to having been TV weathermen. Of course this is not a peer reviewed article nor would any reputable journal publish such drivel.

You can find the specific quote referenced all over the internet at literally hundreds of denier sites but the original is from Fox News (surprise, surprise), The Next Climate-gate?.

However if you wish to at least pretend to have an open mind you should read The IPCC vs. Joseph D'Aleo and Anthony Watts.

The following are but a few excerpts.

Meanwhile, lest we get the impression that the IPCC is the source of all, or even most, errors, a contrarian document has conveniently been published online.  It's called "Surface Temperature Records: Policy Driven Deception?" (pdf here) and it's by Joseph D'Aleo and Anthony Watts.  A reader asked me to comment on it.  It turns out to represent a refreshing change from the IPCC reports.  While it's necessary to dig and dig to find errors in the IPCC reports, the errors in what I'll call STR are right there on the surface, easy to spot.  Here's a sampling:

In paragraph 3, STR states: "First, there is a major station dropout and increase in missing data in stations that remained which occurred suddenly around 1990; about the time the global warming issue was being elevated to importance in political and environmental circles. A clear bias was found towards removing cooler higher elevation, higher latitude, and rural stations during this culling process though leaving their data in the base periods from which ‘averages’ and anomalies are computed."

But as the National Climatic Data Center has explained, there was no such culling process. Instead, the simple, non-sinister explanation is that some data sets are easily available electronically and some are not, and the more recent global data archived by NCDC only consists of the most easily accessible data streams. D'Aleo knows this; it's even quoted in his Icecap blog!  Incredibly, on page 60 he later refers to it as the "unexplained major station dropout" while nowhere in STR does he deign to mention that NOAA has offered a (logical) explanation.

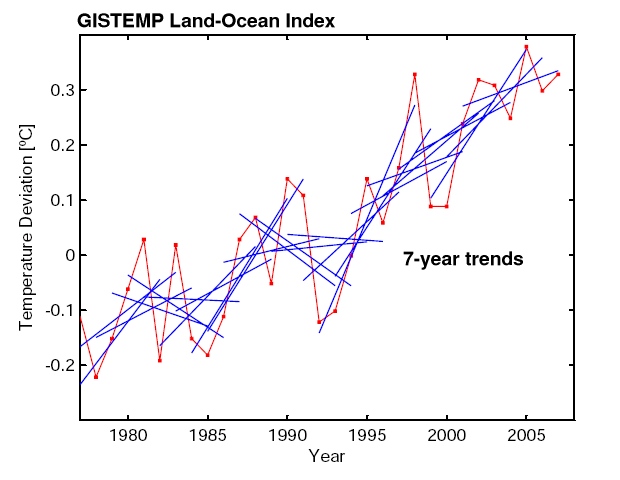
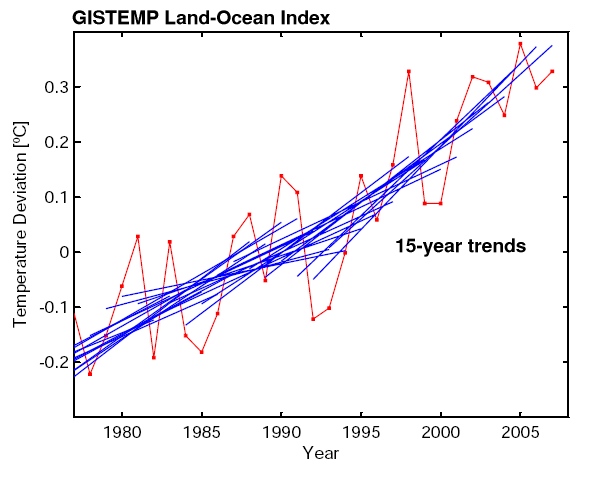
In paragraph 10: "Calculating the average temperatures this way would ensure that the mean global surface temperature for each month and year would show a false-positive temperature anomaly – a bogus warming. This method would also ensure that the trend in the temperature change would be enhanced beyond the natural 60-year climate cycles."

D'Aleo and Watts are saying that because predominantly only warm stations are available in the data set in recent years, the temperature anomalies will be falsely positive and show a bogus warming. Their logic is absolutely wrong, and all major global temperature compilations (NCDC, GISS, and CRUTEM3) are calculated in such a way that a loss of stations like this doesn't bias the anomaly estimates.

The article goes on to explain precisely why their logic is absolutely wrong along with a few more examples of their errors but given that the "report" is just recently "published" there's sure to be more definitive shredding of this so-called work within the next few months. However given how the denialsphere works we can look forward to this same garbage being regurgitated years later, long after everyone already knows it's just a bunch of crap, just so that it may confuse the one or two people left that haven't already heard about it.

Reply #11 Top

If you ever needed proof of the religion surrounding Global Warming, this is it.  If the science is so clear, they shouldn't be needing to distort, lie, and hide as they have been doing.

Then again, they are telling this to people who think Florida will be under water in 10 years.

Reply #12 Top

that by no means suggests that all 15 year intervals are precisely equal or that a longer time interval regardless of start/end points is always a better measure, only that their variation is less
End of quote

But it does mean that it is much more likely to be a better measure, because of the reduced variation - if I was to take a random 7 period trend and a random 15 year trend and extrapolate that over say 20-30 years the 15 year period would be most likely to give the more accurate estimate.

isn't it convenient how that date is the next most recent maximum? Why didn't they back up the start to 1996 or 1994 or god forbid 1992 a local minimum? Because if they had they wouldn't get the result they want.

That's cherry picking.

End of quote

Looking at that graph though they could have also gone to 90-91 and possibly achieved a similar result, making the cherry picking charge carry much less weight than if it was the sole year that could've been used. Thanks for providing the graph though.

Well one reason is that climate is *global* if you want details of a specific country what you're looking for is *weather*.
End of quote

Alright I guess I'm more interested in the (weather) temperature in each country each year then, since that seems of more relevance as the effects will be felt differently depending on the country/location, and also because I don't expect (although I could be wrong since I've pretty well no experience in the area) that a 1deg rise in global temperatures would cause temperatures to rise in every country by 1deg (all else equal). It'd also allow comparisons between the experiences of individual countries compared to what the global picture is saying. I'm sure the data must exist for at least some countries for a number of years but I don't seem able to find it.

Reply #13 Top

But it does mean that it is much more likely to be a better measure, because of the reduced variation - if I was to take a random 7 period trend and a random 15 year trend and extrapolate that over say 20-30 years the 15 year period would be most likely to give the more accurate estimate.
End of quote
First off I'm not a statistician, however I suspect that the "better measure" and "more accurate estimate" is not found by taking *one* random interval of *any* particular length but is found by a proper statistical analysis of the entire set of data, an analysis that I trust more to trained scientists in the field rather than to some random blogger with an agenda making unsupported statements.

Looking at that graph though they could have also gone to 90-91 and possibly achieved a similar result, making the cherry picking charge carry much less weight than if it was the sole year that could've been used. Thanks for providing the graph though.
End of quote
You're welcome.

You're also right that there's more than one specific set of end points that could be chosen that would show less of an effect. However the bottom line is, is there an upward trend or isn't there? I look at the graph and there seems to me a pretty obvious upward trend regardless of whether someone has drawn in trendlines of any particular length or not.

Even those that disagree generally don't argue that there is no upward trend in that graph. Instead they argue that the datapoints themselves have been doctored or that if there is an upward trend it's not due to human activity or the graph shows that global warming stopped in 1998 or myriad other reasons (or excuses dependent on your point of view).

I don't expect (although I could be wrong since I've pretty well no experience in the area) that a 1deg rise in global temperatures would cause temperatures to rise in every country by 1deg (all else equal).
End of quote
The thing is that a 1°C global average temperature rise really would not make one heck of a lot of difference to the weather of *any* country, at least directly. It's the indirect effects that are of concern. Like how much will sea levels rise based on that 1°C rise and what locales will be affected by that amount of sea level rise. Or how that 1°C rise will affect weather patterns over the globe and whether what was one countries breadbasket becomes a desert or not.

I'm sure the data must exist for at least some countries for a number of years but I don't seem able to find it.
End of quote
And if you were able to find the raw data that you're looking for then what? Do you really believe that with no obvious training that your interpretation of that data will be anywhere near as good as those that have studied in the field for years achieving specifically related advanced degrees that publish their results in peer reviewed articles in respected journals?

To me that's the problem with these so called skeptics. Too many arm chair quarterbacks that presume that they can do someone else's job better than well respected scientists with PhD's in specifically related fields.

If these people really were all that smart then they could prove it by publishing peer reviewed articles in respected journals either proving their point or disproving the real climate scientists. But they don’t, because they can’t.

Reply #14 Top

Alright I guess I'm more interested in the (weather) temperature in each country each year then,
End of quote
Then go to here.


Reply #15 Top

First off I'm not a statistician
End of quote

Agreed.

You could change the title of this thread from "Climate is cooling according to Jones" to "Climate is warming according to Spencer" and be equally honest.
End of quote

Sound like 'settled science' to you?

If these people really were all that smart then they could prove it by publishing peer reviewed articles in respected journals either proving their point or disproving the real climate scientists. But they don’t, because they can’t.
End of quote

I'm sure they could get them published in the same journals that the IPCC relied upon for the Himalayan glacier, Amazon forest & Dutch drowning claims.  If they're good enough for the IPCC, should be good enough for you.

calculated in such a way
End of quote

Why 'such a way'?

infamous deniers with documented ties to ExxonMobil
End of quote

And the alarmists have no financial interests or disclosures to make.  Right.

AGW advocates are sure having to spend a lot of time 'denying' stuff lately.  Hard to tell the deniers from the Deniers.

Reply #16 Top

http://www.youtube.com/watch?v=_PWDFzWt-Ag

Reply #17 Top

Good little vid, stub.  Thanks for the link.

Reply #18 Top

It seems that no one with a brain bothers to look at anything more than a few dozen years of data to make predictions over the next hundred years. I wrote about this almost two years ago and so far, it has proven true.

To summarize what I wrote: the sun is the source of heat in the solar system. The Earth is still coming out of the last big ice age from a billion years ago. NASA has proven this, meaning that the solar system is warming. NASA proved this 40 years ago and it seems the global warming people only want to use some of the data not all of it. Our planet along with all the other planets have been warming at the same rate so unless you can prove that we are warming all the planets because of man then man is not the cause of global warming. Yes, the planet is getting warmer and will continue to get warmer as the SUN expands. My estimates are 140k years before the oceans start to boil away. The experiments on the Moon in the 70’s confirm that it has already started and documented but again no one wants to look at old data. Look at the planet Venus, it has no humans yet it has boiled away almost all of its water. Look at the Sahara, it used to be green and lush valleys and is now a barren region what makes you think that we caused this? the climate has been changing for millennia yet people only want to focus on the last fifty years. How can you honestly say that the warming trend we are going through is caused by man when the planet has been proven to be warming for over a hundred million years? Man has only been around for the last ten thousand years. It is short sighted to point to man as the cause, or even as a contributing factor.

The SUN stopped having sunspots and we start cooling at the same time. This was predicted by science years ago and still we want to say it is man that caused warmth or cold. Yes, you can say man is the cause if you exclude volcanoes, the heat from the Sun, and the Earth’s orbit around the Sun, then and only then can you point to man as the cause. Until then all we have is idiots running around screaming the sky is falling. Can we stop this warming or cooling? NO! Did man cause this warming or cooling? NO! Can man contribute to the warming or cooling? YES! In the same way that a mosquito bite contributes to a man with a slashed throat bleeding to death.

Reply #19 Top

Reply #20 Top

Solar forcings are also discussed here.


Reply #21 Top

At least now we've had several Climate Alarmist Crocks of the Week to compete, so to speak.

Reply #22 Top

At least now we've had several Climate Alarmist Crocks of the Week to compete, so to speak
End of quote
The second video is from the same author and is in fact part of the same series as the video posted by stubby above that you seemed to like so much. The crock of the week is a different series and an entirely different author.

Funny how who posted the link matters more to you than the content of the video itself.

Did you in fact even bother to watch stubby's video, because it was fully supportive of Phil Jones *and* AGW.

Reply #23 Top

Funny how who posted the link matters more to you than the content of the video itself.
End of quote

You're right, that is funny, coming from a guy who has no interest in my opinion.  I have to laugh at your self-absorption, Mumble.

I said it was good, not that it was a definitive defense of AGW.  I happen to understand the concept of 'statistical significance' and it ain't all it's cracked up to be, let alone some holy grail, when it comes to establishing cause and effect relationships.  Besides, I've never said we weren't in the midst of a warming period; I think the evidence is pretty strong that we are (or, perhaps, have been), but it's not a slam dunk that this is the warmest it's ever been.  That Jones, Mann & the other principals providing the substantive underpinning of AR4 have been, shall we say, exagerating a bit seems pretty clear, however.

My scepticism has always been about what the warming is being used for - about the proposition that anthropogenic CO2 is the principal cause and that we must therefore do something drastic to our global economy, and further that doing that something will somehow fix it.  That piece of it has become a racket.

Oh, and stubby's never called me an asshole. ;)

Reply #24 Top

Oh, and stubby's never called me an asshole.
End of quote
Ah, that explains it.

And of course I called you an asshole without any provocation on your part, at least as far as you remember.

Reply #25 Top

Ah, that explains it.
End of quote

Whatever floats your boat, my friend.